
RISKCOMPASS ATLAS / PUBLIC PREVIEW
See the landscape.
Go deeper into the asset.
Wind. Solar. Storage. The grid between them.
Explore the map freely. Request paid access for a closer look at the assets that matter to you.
Solar sites shown. Zoom closer for individual installations and arrays.
Zoom in for grid routes and equipment. © OpenStreetMap contributors · ODbL · Natural Earth
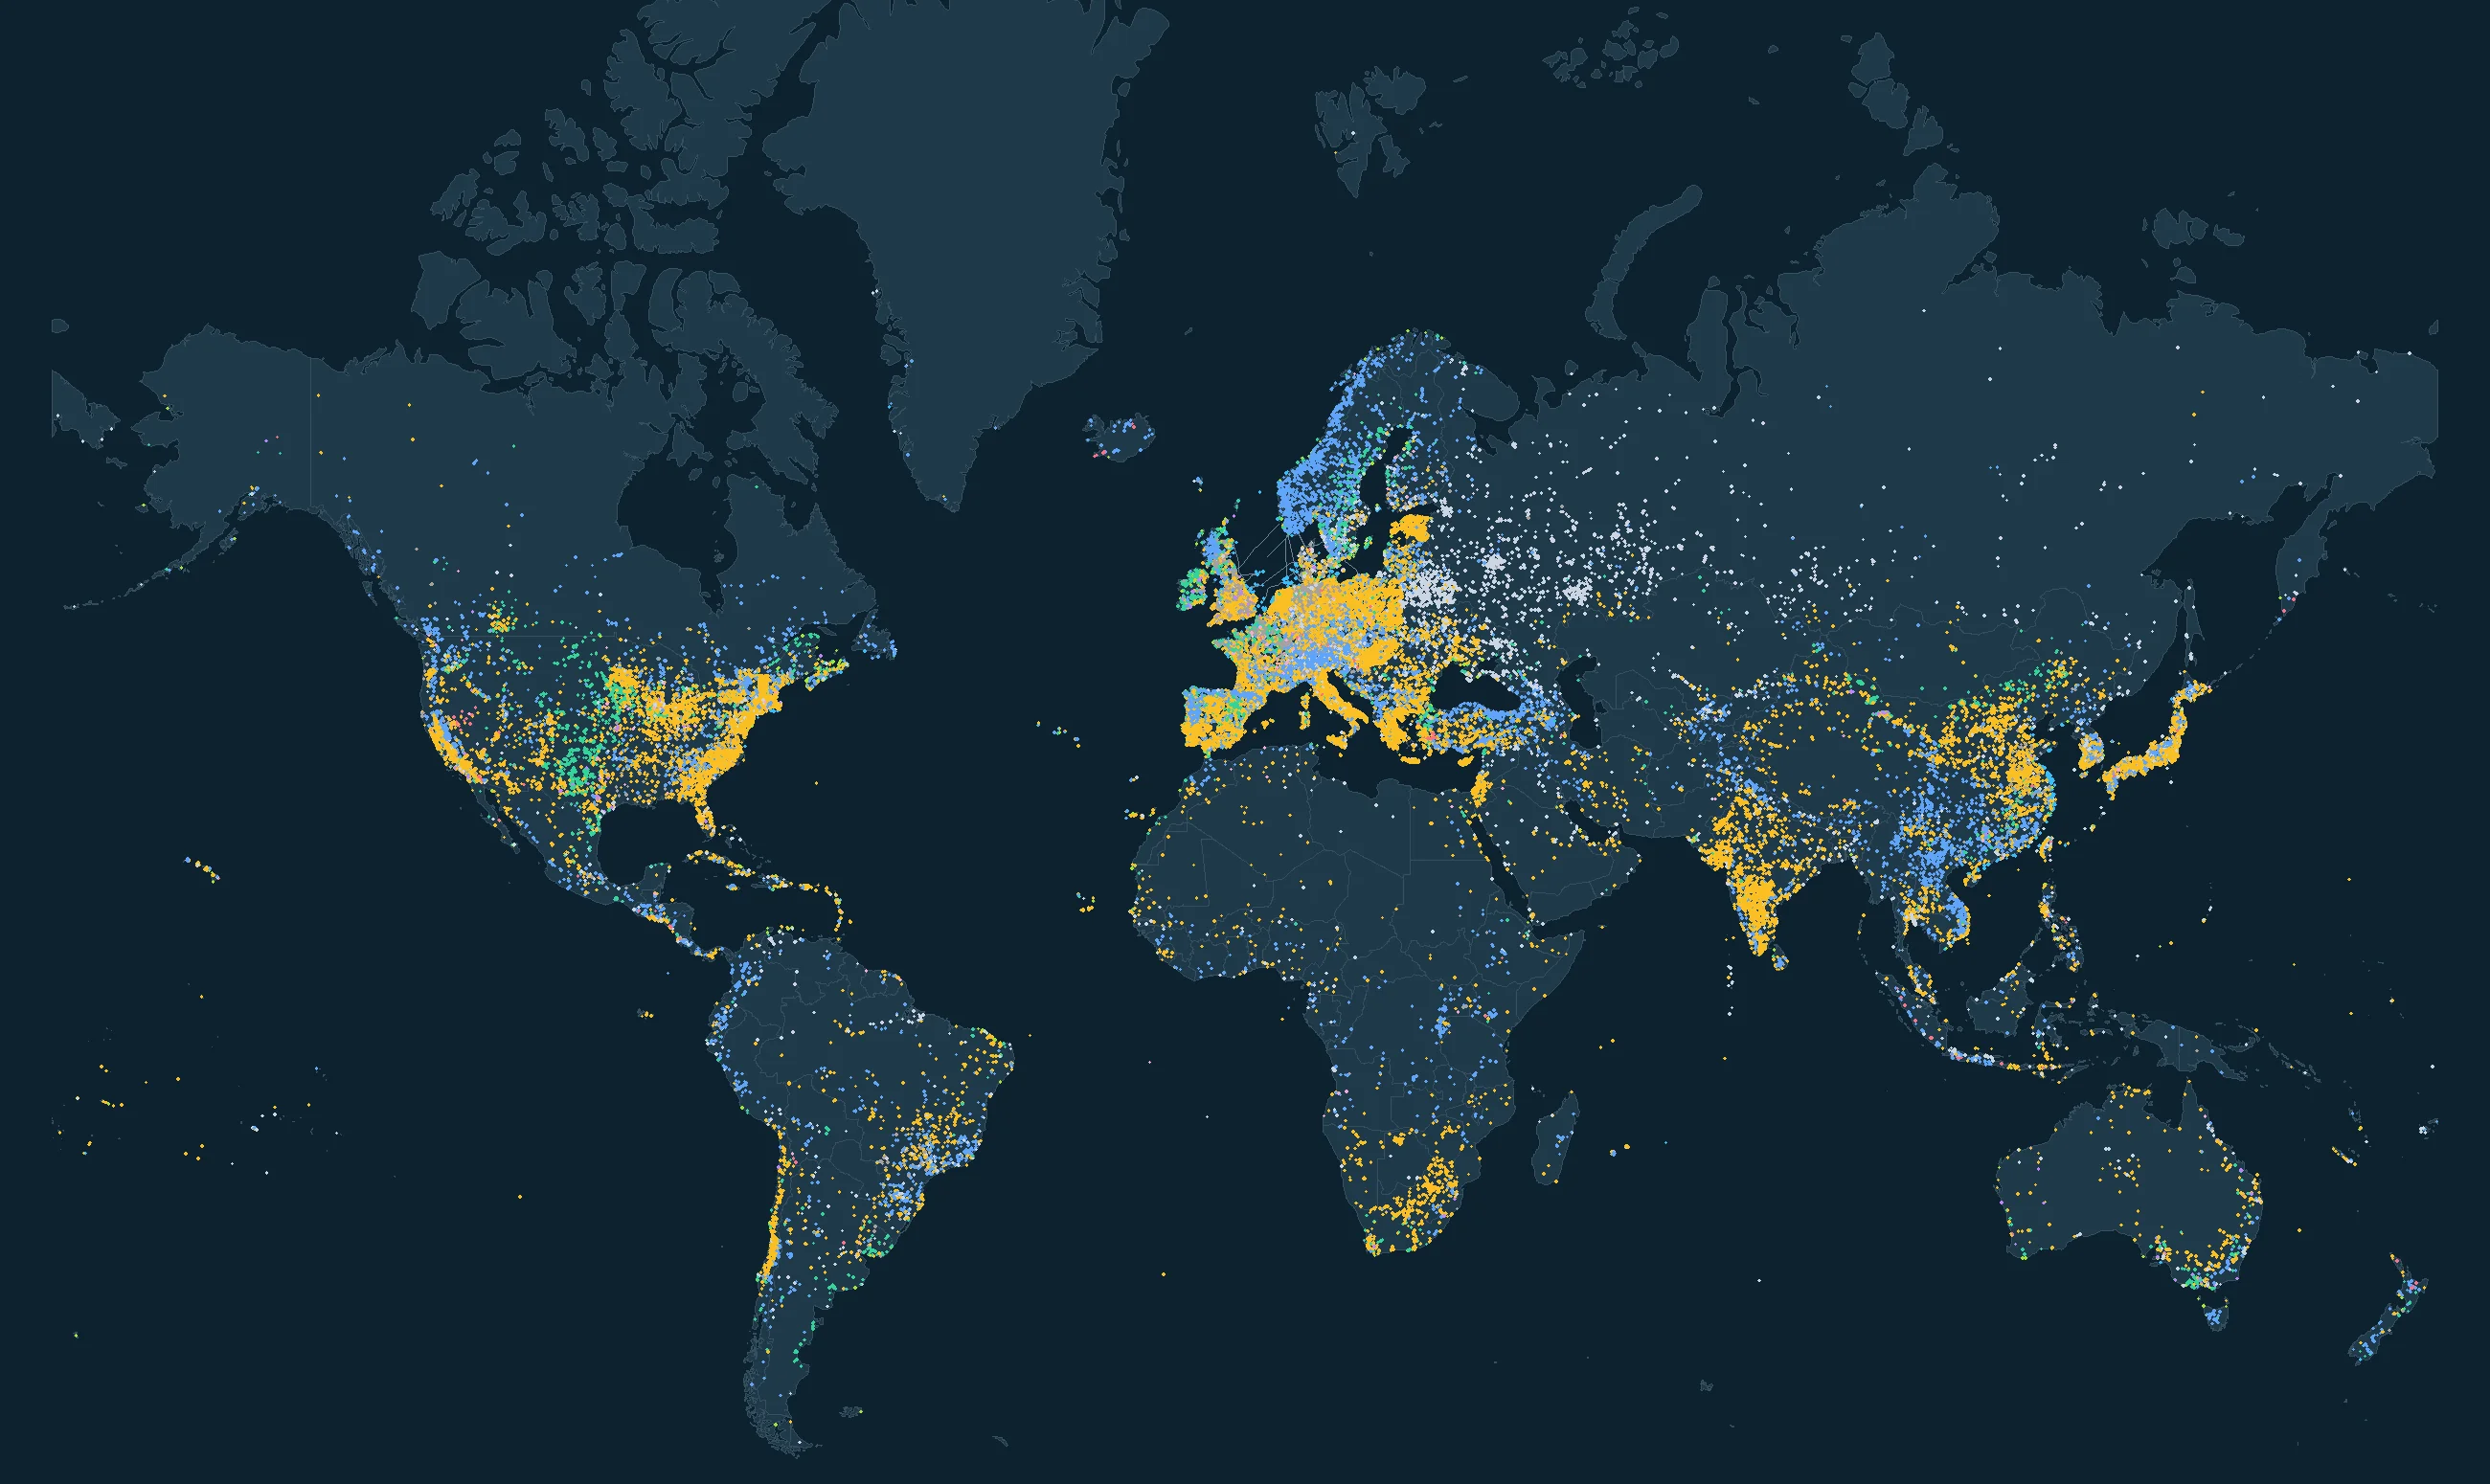
The data behind the map
Rounded worldwide record counts · March 2025 snapshot · not a verified asset census.
See every category and the global technology breakdown
Global site catalogue
101,471 site records, by technology. Includes mixed and unclassified records.
| Offshore wind | 337 |
|---|---|
| Onshore wind | 8,738 |
| Wind · location unknown | 654 |
| Solar | 68,115 |
| Battery storage | 411 |
| Hydro | 12,601 |
| Marine energy | 14 |
| Geothermal | 296 |
| Bioenergy | 3,256 |
| Mixed sources | 357 |
| Unclassified | 6,692 |
Worldwide components & grid
Exact imported record counts. Components are not additional projects. Grid routes and equipment are downloaded for the visible area at closer zoom.
| Wind turbines | 405,579 |
|---|---|
| Other wind generators | 21,487 |
| Solar installations / arrays | 3,533,792 |
| Battery installations | 630 |
| Other generators | 30,534 |
| Substations | 734,690 |
| Towers / poles | 33,308,779 |
| Transformers | 201,639 |
| Switches | 127,992 |
| Compensators | 6,562 |
| Line / cable sections | 2,268,311 |
Coverage, sources & limitations
This fixed snapshot uses OpenStreetMap-derived records from an Infrageomatics export dated 4 March 2025. Sites, generators and grid components are imported worldwide, without a regional bounding box. Coverage varies by location and technology; this is not a complete or live asset census. Fossil-only and nuclear-only generation records are excluded; mixed and unclassified records remain labelled as such.
The public snapshot contains 38,473,155 record positions and 2,268,311 line/cable sections as simplified routes. Sites, generators and substations load progressively worldwide. Dense grid routes load from zoom level 2 and equipment from level 4. Solar sites remain visible at wide zoom; individual solar installations appear from level 6, or at every zoom with the solar-detail option enabled. This is a record-category display rule, not a project-size or capacity filter. No records are deleted or randomly sampled. Overlapping pixels can hide individual dots. Polygons use representative points rather than full footprints. The “in this view” counters include loaded solar positions hidden by the detail rule; grid counts are incomplete while tiles load.
Sites and their components are separate categories: a solar-array record is not a solar panel or necessarily a separate project. Battery sites are already included in the site total; battery installations may belong to those same sites. Wind records without turbine tags may also represent turbines. Geographic relationships do not establish ownership, electrical connectivity or available grid capacity. Offshore/onshore classification can be geographically estimated. Source records have not been deduplicated into a physical-asset census.
Data export: Infrageomatics · OpenStreetMap data and ODbL licence. Simplified basemap: Natural Earth. Map presentation built with Poind.
FROM THE LANDSCAPE TO YOUR PORTFOLIO